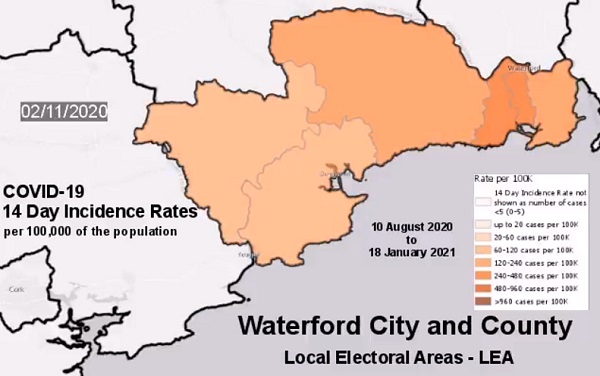
New data from the Central Statistics Office shows how the 14-day incidence rate of Covid-19 has evolved across Waterford City and County since August.
Every Thursday a breakdown of cases in each of the State’s 166 electoral areas is released.
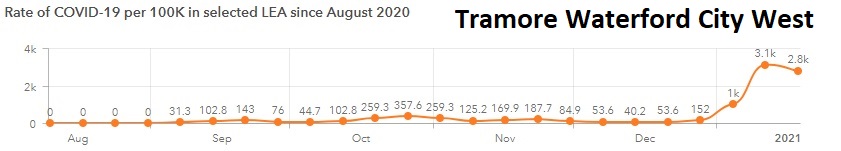
The time-series graphic produced by the CSO today shows there were very few cases in Waterford in August, for the past two weeks Tramore Waterford City West had among the highest incidence rates in the country.
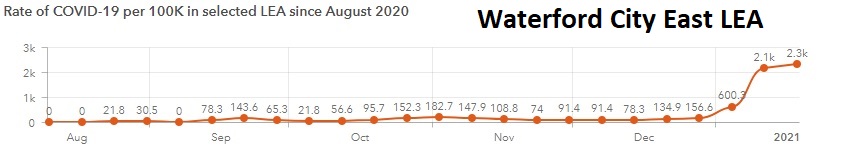
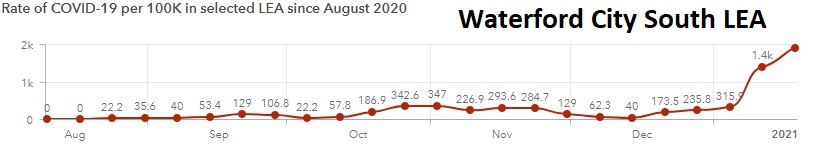
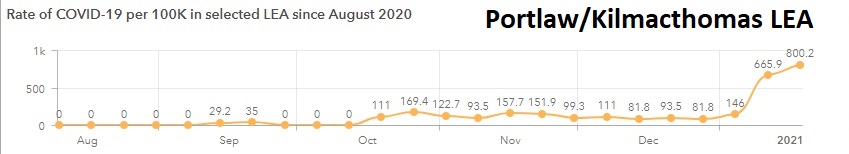
The 14 day Incidence Rates for COVID-19 for Waterford City and County between 10 August 2020 to 18 January 2021#CSOIreland #Ireland #COVID19 #COVID19Ireland #14DayIncidenceRates #TimeSeries #Waterford #10August2020to18January2021 #LocalElectoralAreas #LEA #arcgispro pic.twitter.com/icUSK0qTIG
— Central Statistics Office Ireland (@CSOIreland) January 22, 2021
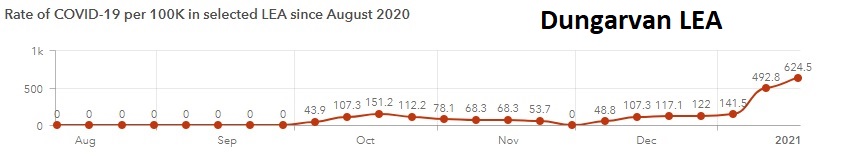
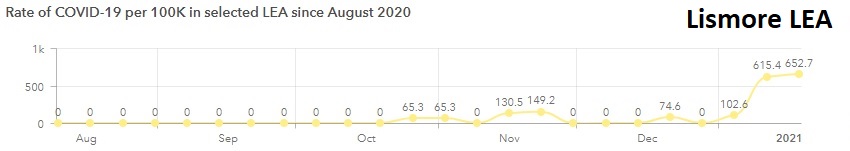
Graphs have also been published on the Covid-19 Data Hub for each Local Electoral Area. The graphs show how previous spikes in cases during October in Waterford pale in comparison to recent weeks.